Resources
Background
To consolidate my understanding of TSQL and Tableau , I undertook this interesting project on healthcare data from 318 California-licensed hospitals collected by Department of Health Care Access and Information (HCAI) .
What are the IMIs?
The Inpatient Mortality Indicators(IMIs)are part of a suite of measures called Inpatient Quality Indicators that are developed by the federal Agency for Healthcare Research and Quality (AHRQ).These measures provide a perspective on hospital quality of care and are calculated using patient data reported to the Department of Health Care Access and Information (HCAI)by all California-licensed hospitals. The IMIs consist of six medical conditions:
- Acute Myocardial Infarction,
- Acute Stroke,
- Heart Failure,
- Hip Fracture,
- and Pneumonia
and five surgical procedures:
- Abdominal Aortic Aneurysm Repair–Open and Unruptured,
- Abdominal Aortic Aneurysm Repair –Endovascular and Unruptured,
- Carotid Endarterectomy,
- Pancreatic Resection,
- and Percutaneous Coronary Intervention
Why are IMIs essential?
HCAI reports IMIs for California hospitals to improve the quality of patient care in the state through greater transparency,to help consumers make more informed healthcare decisions,to help payers and employers spend their healthcare dollars wisely,and to provide hospitals performance benchmarks that aid in their review of internal processes of care and quality improvement activities.
What are risk-adjusted IMIs?
Data to calculate the IMIs come from all California-licensed acute care hospitals. All IMIs include risk-adjustment, a process that takes into account patients' pre-existing health conditionsto “level the playing field” and allow for fair comparisons among hospitals.
Additional information about the IMI calculation methods and technical details about their validity and limitation can be found on the AHRQ website.
The aim of anaysis and visualisation:
- Gain insight into performance of each hospital for the 2020 tenure.
- Identify Procedures/Conditions that had dangerous inpatient mortaility levels.
- help users make more informed decisions for their hospital visits.
- Establish the performance of each hospital against the statewide benchmark.
I completed the analysis and visualisation of the results in May 2023.
Working
Tools used:
Data cleaning and transfromation: TSQL via Microsoft SQL server Management Studio
- creting a new temp table to omit the rows containing the statewide results, thereby only having the results at county level.
- Handling nulls
- Creating two separate columns to house the name of the hospital, and the the campus location, if present.
- renaming colums for easy identification
Data analysis: TSQL via Microsoft SQL server Management Studio
- PART 0: Calculate the average Risk Adjusted Rate (RAR) for each hospital,
- PART I: Which hospital should you avoid in California based on your procedure/condition?,
- PART II: What is the worst performing indicator of each hospital?,
- PART III: Count of various types of hospital ratings for each hospital,
- PART IV: top ‘Better’ and ‘worse’ performers among hospitals and
- PART V: number of better and worse performing hospitals for each indicator for Tableau
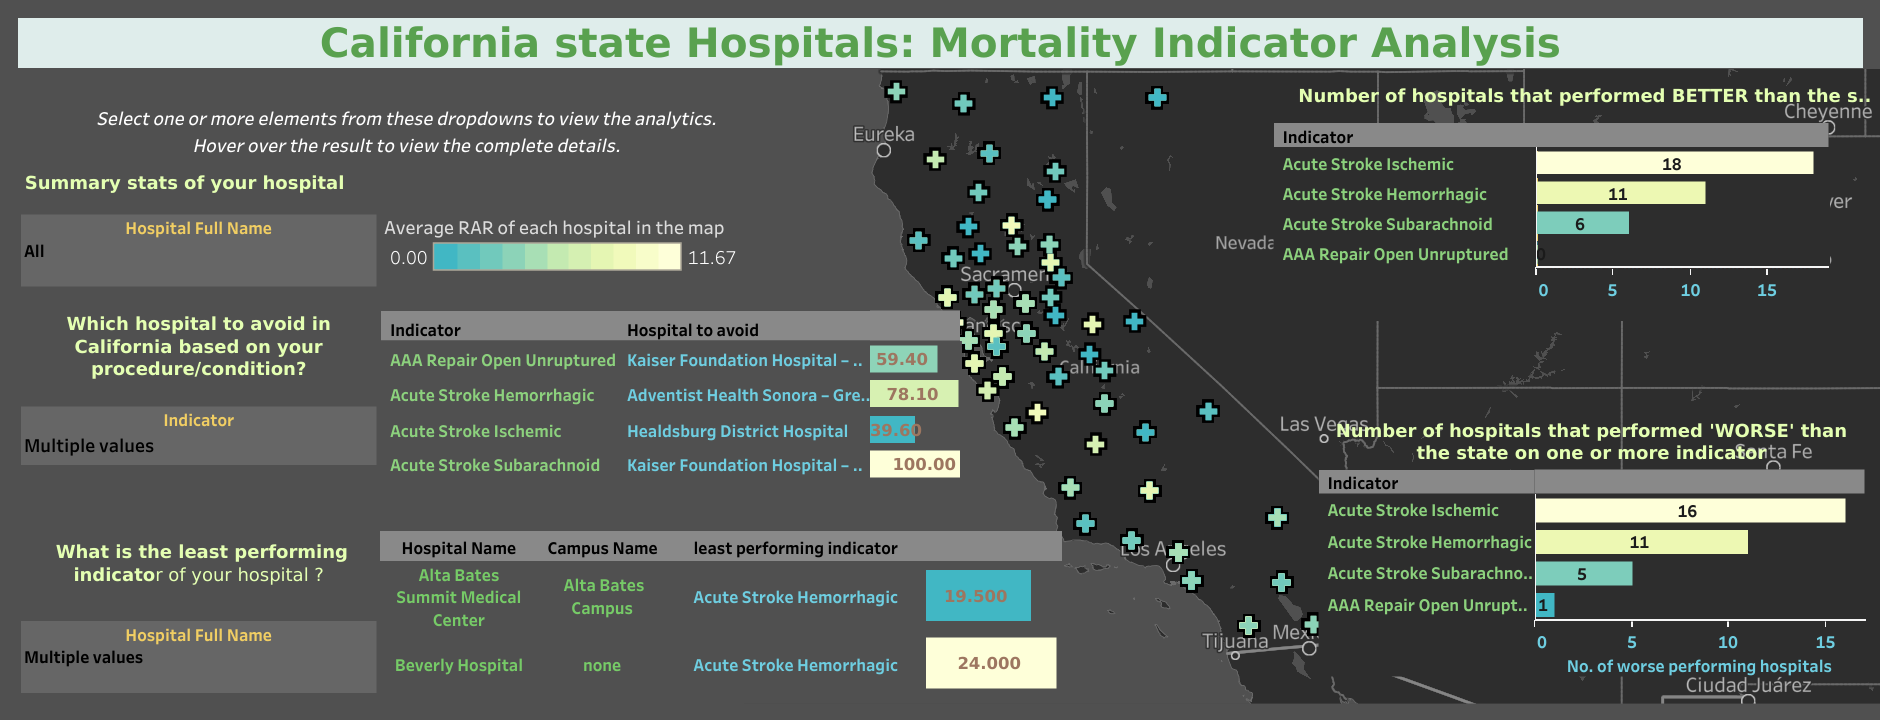
Data Visualisation: Tableau Public
an interactive dashboard that filters out the result based upon the input selection
- Summary stats for each hospital listed out on a map chart
- Number of hospitals that performed better than the state on one or more indicator
- Number of hospitals that performed worse than the state on one or more indicator
- Which hospital to avoid in California based upon your procedure/condtion
- what is the least performing indicator for each hospital
Interesting Results:
-
Better and worse rated procedures: out of the 64 “better” rated hospitals, 35 were rated better on a single indicator, 21 were rated better on two or three indicators and 8 were rated better on more than three indicators. Regional Medical Center Of San Jose and UC Irvine Medical Center outperformed by having 7 indicators that were rated better than the state results.
83 hospital were rated worse than the state for one or more inidcator. Out of these, 43 were rated worse on a single indicator, while 39 were rated worse on more than one indicator. Palomar Health Downtown Campus was rated worse on six indicators and Saint Agnes Medical Center was rated worse on five indicators.
-
Maximum Risk Ajusted Mortality Rates(RARs): Pancreatic Resection and Acute Stroke Subarachnoid had an RAR of 100.0 for Seton Medical Centre and Kaiser Foundation Hospital- West Los Angeles, respectively.